Brewery production analytics and real-time reporting dashboards
Visualize beer and wine production data with real-time dashboards. Track yield rates, production costs, tank utilization, and inventory turnover. Export custom reports for TTB compliance and operational insights.
See everything, act on what matters
From daily production metrics to long-term trend analysis, BrewPlanner puts the data you need at your fingertips.
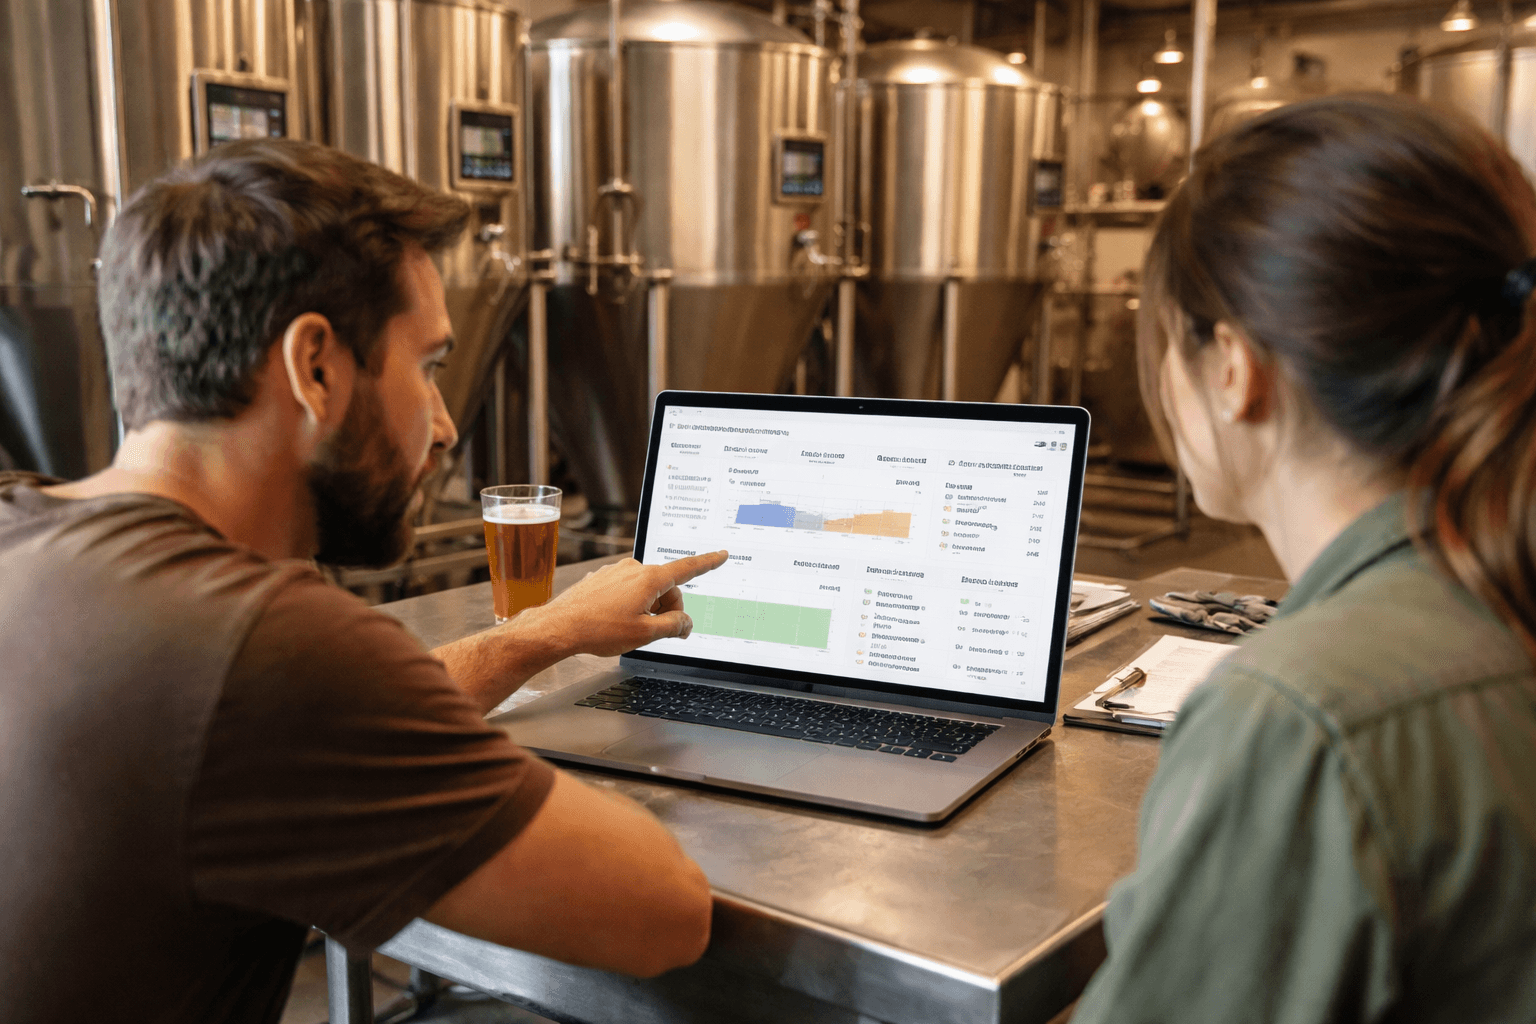
Production Dashboards That Surface What Matters
See your entire operation at a glance with real-time dashboards built for breweries and wineries. Monitor yield rates, tank utilization, cost per barrel, and batch cycle times without digging through spreadsheets.
- Pre-built KPI dashboards for production, inventory, and sales
- Real-time tank utilization and batch status views
- Daily, weekly, and monthly production summaries at a glance

Custom Report Builder
Create the exact reports your team needs. Drag and drop data fields, apply date ranges and filters, then export to CSV or PDF. Schedule reports to run automatically so stakeholders get the numbers they need without asking.
- Drag-and-drop report builder with flexible filtering
- Scheduled report delivery via email to any stakeholder
- Export to CSV and PDF for board meetings and compliance filings
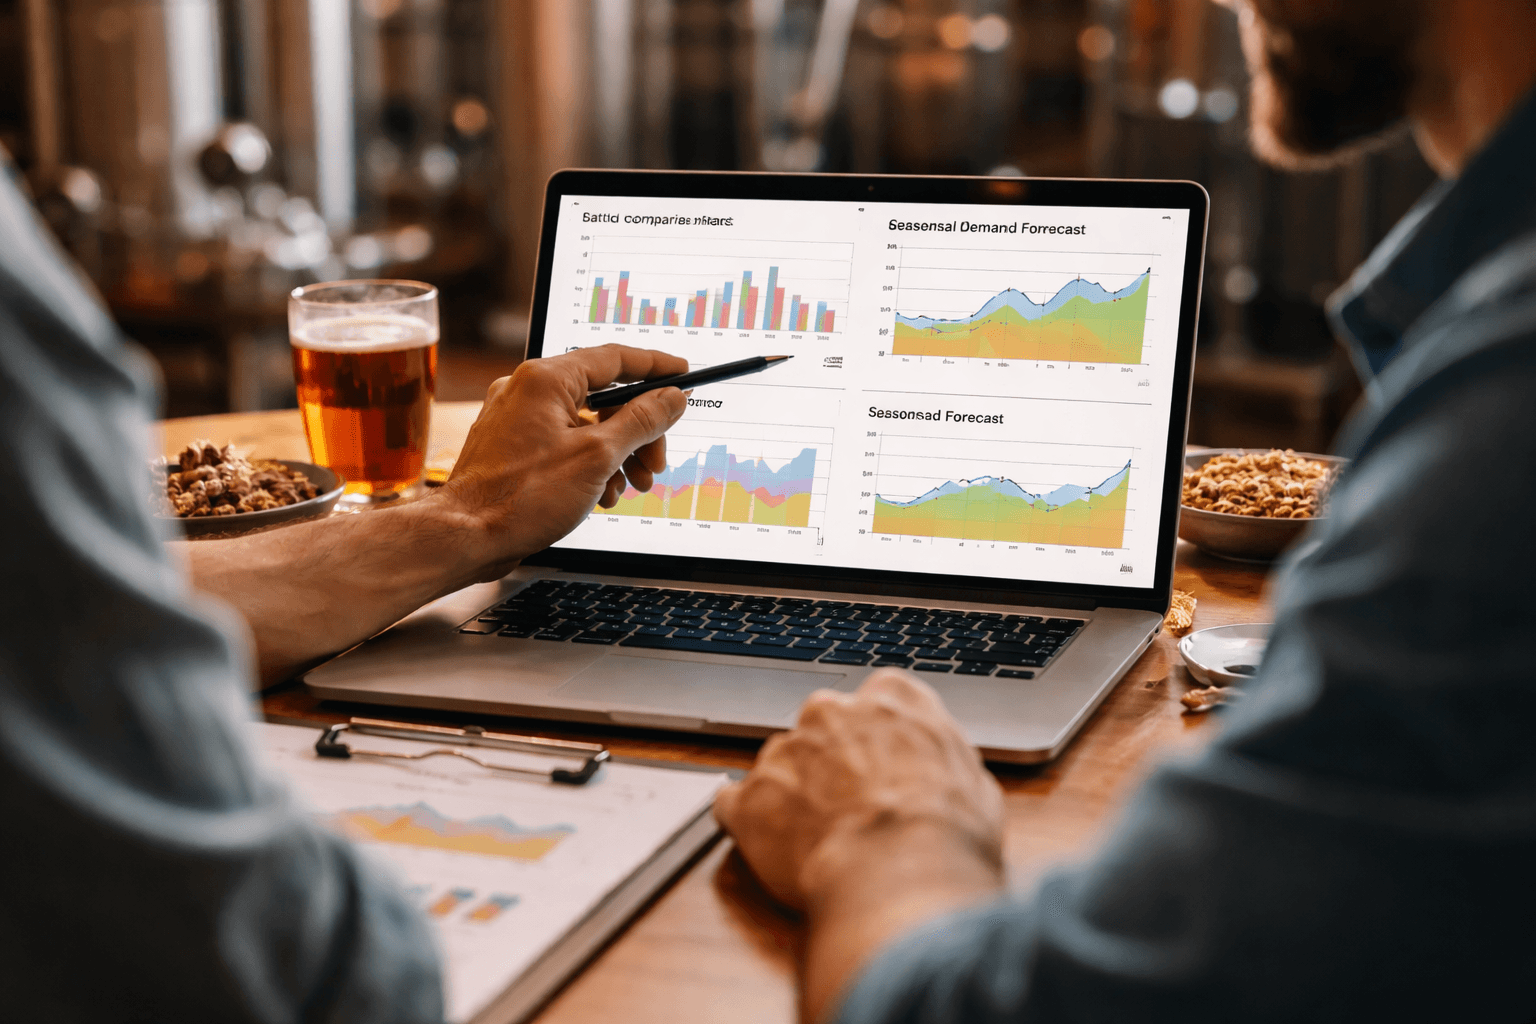
Trend Analysis and Historical Comparisons
Spot patterns across batches, seasons, and years. Compare yield rates between recipes, track ingredient cost fluctuations over time, and identify the operational changes that moved the needle on efficiency.
- Batch-over-batch comparison charts for yield and quality
- Ingredient cost trend tracking across suppliers and seasons
- Seasonal demand forecasting based on historical production data
Why breweries rely on BrewPlanner analytics
Purpose-built reporting for beverage production, not generic business intelligence tools.

Complete Visibility
Every team member sees the same real-time data — from the brewhouse floor to the front office — so decisions are based on facts, not assumptions.

Faster Decision-Making
Surface the metrics that matter in seconds instead of hours. Pre-built dashboards eliminate the time spent compiling data from multiple sources.

Simplified Compliance
Generate TTB reports, production logs, and audit-ready records with a few clicks. Keep your compliance documentation accurate and up to date automatically.

Continuous Improvement
Track trends over time to identify what is working and what is not. Use historical data to set realistic production goals and measure progress toward them.
Reporting & analytics FAQ
Ready to see what your data is telling you?
Join hundreds of breweries and wineries using BrewPlanner to turn production data into smarter decisions.
Try BrewPlanner Free