Most brewery owners can tell you their total revenue. Fewer can tell you which sales channel actually makes them money. That gap between knowing your top line and understanding your bottom line by channel is where profitability quietly leaks away.
Here's the uncomfortable truth: a brewery pulling $2 million in annual revenue can look healthy on paper while its distribution arm silently bleeds cash. Or the opposite. A thriving taproom might be subsidizing a self-distribution operation that nobody has bothered to audit. Without financial tracking that separates taproom and distribution profitability, you're making strategic decisions based on incomplete information.
The fix isn't hiring a CFO or buying enterprise accounting software. It's building a chart of accounts and reporting framework that reflects how your brewery actually generates revenue and incurs costs. With the right brewery management software feeding accurate production and sales data into your financial system, you can see exactly where every dollar goes and, more importantly, where it stays.
This guide walks you through setting up channel-level financial tracking from scratch. We'll cover structuring your chart of accounts, allocating costs properly between channels, building useful P&L reports by sales channel, and using those reports to make smarter decisions about where to invest your time and capital.
Building a Chart of Accounts That Reflects How Breweries Actually Operate
A standard QuickBooks chart of accounts wasn't designed for breweries. It lumps all revenue into one bucket, treats all cost of goods sold as a single line, and gives you zero visibility into whether your taproom pint sales or your keg distribution is driving profits. The first step in channel-level financial tracking is restructuring your chart of accounts to mirror your actual business model.
Revenue Accounts by Channel
Start by creating separate revenue accounts for each sales channel. At minimum, most breweries need three to five top-level revenue categories:
- Taproom draft sales (pints, flights, growlers sold on-premise)
- Taproom packaged sales (cans, bottles, crowlers sold to-go)
- Distribution draft (kegs sold to bars, restaurants, accounts)
- Distribution packaged (cases and pallets sold to distributors or retailers)
- Other revenue (merchandise, events, contract brewing)
This separation matters because the gross margin on a $7 taproom pint is dramatically different from the margin on a $130 half-barrel keg sold through distribution. A brewery selling 60% of its volume through distribution might generate less gross profit from that channel than from the 40% sold through the taproom.
Make each revenue account a sub-account under a parent "Revenue" category so your total revenue still rolls up cleanly for tax reporting and lender requirements.
COGS Accounts That Track Cost Per Channel
This is where most breweries stumble. They track raw material costs in aggregate, with no connection to which channel consumed those goods. Your COGS structure needs to account for the fact that a barrel sold through the taproom costs differently than a barrel sold through distribution, even though the liquid inside started in the same tank.
Create COGS sub-accounts that capture:
- Raw materials (grain, hops, yeast, water treatment)
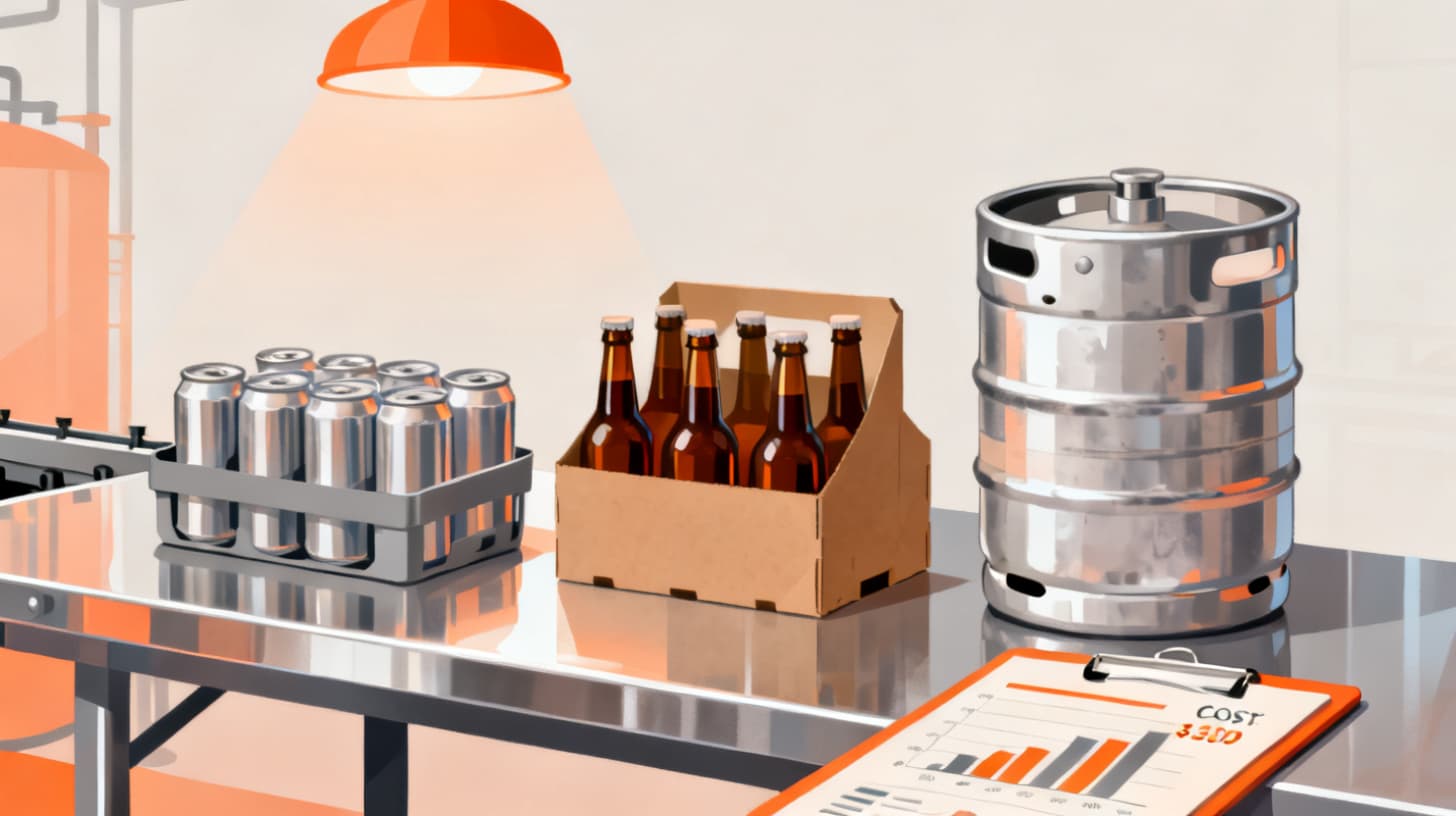
- Packaging materials by format (cans, labels, carriers, keg costs)
- Direct labor by channel (taproom staff vs. production staff vs. delivery drivers)
- Excise taxes (federal and state, which vary by channel in some jurisdictions)
- Freight and delivery costs (distribution-specific)
The raw material cost per barrel stays constant regardless of channel. What changes is packaging cost, labor allocation, and delivery expense. A barrel sold as pints in the taproom costs virtually nothing to package but requires bartender labor. A barrel sold as cans through distribution requires packaging materials, labeling, palletizing, and freight. These differences add up fast.
Accurate COGS starts with knowing your true cost per barrel, including the indirect costs many breweries overlook. For a detailed breakdown of every cost component you should be tracking, read how to calculate and track true brewery COGS per barrel.
Operating Expense Allocation
Below the gross profit line, create operating expense categories that can be split by channel where appropriate:
- Taproom-specific expenses: POS system fees, taproom rent (if separate), glassware, cleaning supplies, taproom marketing, event costs
- Distribution-specific expenses: sales rep salaries, trade spend, distributor margin or placement fees, vehicle maintenance, route planning software
- Shared expenses: brewery rent, utilities, insurance, equipment depreciation, administrative salaries
Shared expenses get allocated using a method we'll cover in the next section. The goal here is to separate what you can attribute directly, so your allocation of shared costs is as small a percentage as possible.
Allocating Shared Costs Without Guessing
Every brewery has costs that serve both channels. The rent on your building houses both the production floor and the taproom. Your head brewer's salary supports liquid that flows through both channels. Utilities keep the lights on everywhere. Pretending these costs belong to one channel or splitting them 50/50 creates misleading profitability numbers.
The solution is picking an allocation method that's reasonable, consistent, and simple enough that you'll actually maintain it.
Volume-Based Allocation
The most straightforward approach allocates shared costs based on the percentage of barrels flowing through each channel. If 45% of your annual production goes through the taproom and 55% goes through distribution, shared costs split accordingly.
This works well for production-floor costs like brewing labor, utilities tied to production equipment, and equipment depreciation. It's less accurate for overhead like rent, because your taproom might occupy 30% of your physical space while consuming 45% of your production volume.
Square Footage Allocation
For rent, property taxes, and building insurance, allocating by square footage is more defensible. Measure the taproom footprint (including seating areas, bar space, and taproom storage) against the production and warehousing footprint. If the taproom is 2,000 square feet out of a 10,000-square-foot facility, it gets 20% of occupancy costs.
Some breweries use a hybrid approach: square footage for occupancy costs and volume for production costs. This adds a small layer of complexity but produces more accurate channel P&Ls.
Revenue-Based Allocation
For administrative overhead, marketing, and general management salaries, revenue-based allocation often makes the most sense. If the taproom generates 55% of total revenue, it absorbs 55% of general and administrative expenses.
The key principle is this: pick a method, document it, and apply it consistently. Changing your allocation methodology every quarter makes trend analysis meaningless. Here's a practical allocation framework:
Cost CategoryAllocation BasisExample SplitRaw materialsDirect attribution by batchTracked per batchPackaging materialsDirect attribution by formatTracked per SKUProduction laborVolume (barrels by channel)45% taproom / 55% distroDelivery laborDirect to distribution100% distributionTaproom staffDirect to taproom100% taproomRent and occupancySquare footage20% taproom / 80% productionUtilitiesHybrid (50% sq ft, 50% volume)Calculated monthlyAdmin and G&ARevenue percentage55% taproom / 45% distroMarketingDirect where possible, revenue % for generalVaries
Getting this right requires clean production and sales data. When your inventory management system tracks materials consumed per batch and finished goods flowing to each channel, your COGS attribution becomes automatic instead of a manual spreadsheet exercise every month.
Building Channel P&L Reports That Drive Decisions
A chart of accounts is just infrastructure. The value comes from the reports you generate. Your goal is a monthly P&L statement for each sales channel that tells you, at a glance, which channel earns its keep and which one needs work.
What a Channel P&L Should Look Like
Here's a simplified example for a brewery producing 3,000 barrels annually, selling roughly half through the taproom and half through distribution:
Line ItemTaproomDistributionTotalRevenue$840,000$510,000$1,350,000Raw Materials COGS($105,000)($115,000)($220,000)Packaging COGS($12,000)($78,000)($90,000)Direct Labor($168,000)($72,000)($240,000)Freight/Delivery$0($48,000)($48,000)Gross Profit$555,000$197,000$752,000Gross Margin66.1%38.6%55.7%Allocated Overhead($135,000)($115,000)($250,000)Channel-Specific OpEx($95,000)($62,000)($157,000)Channel Profit$325,000$20,000$345,000Channel Margin38.7%3.9%25.6%
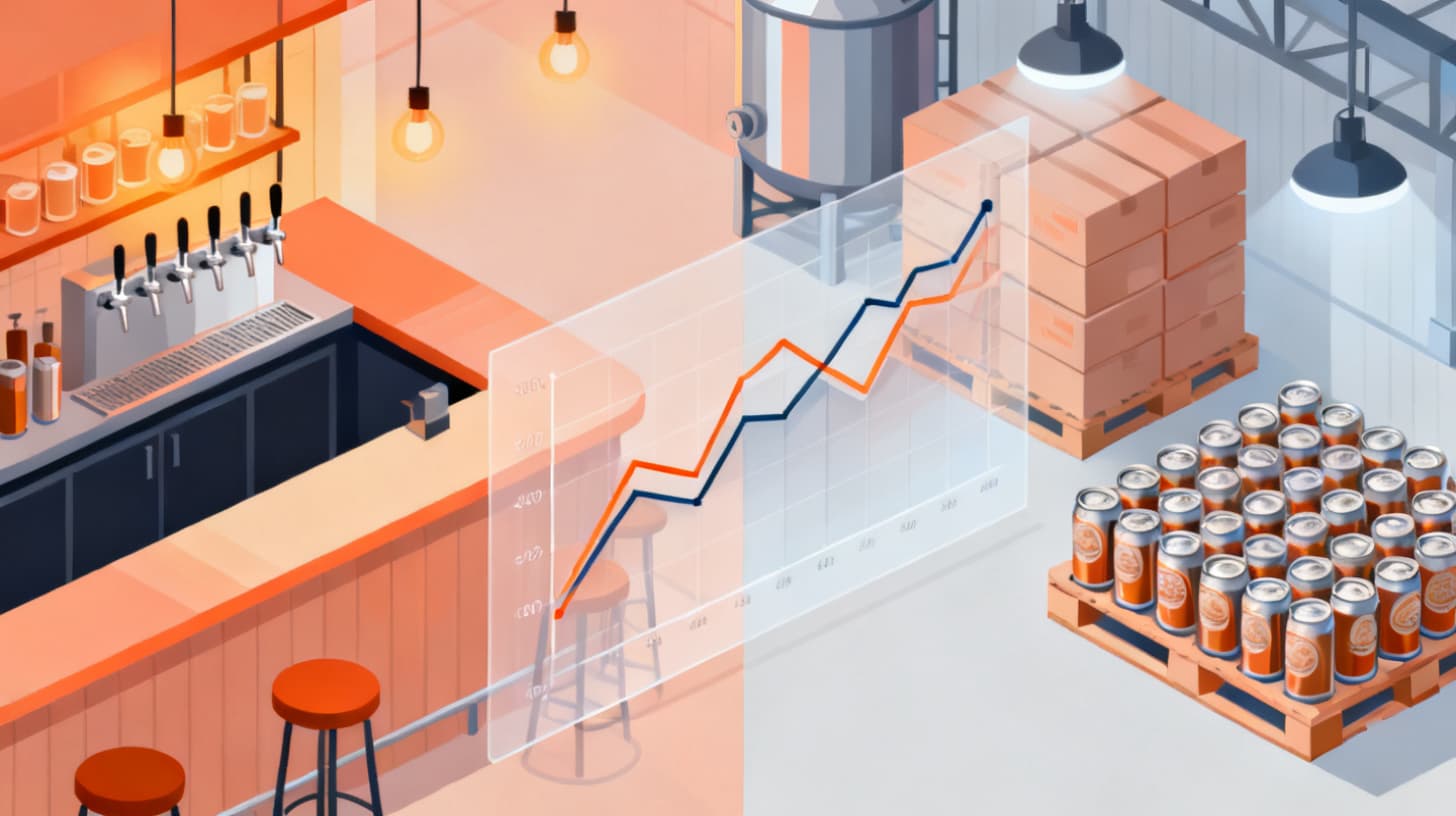
Look at those numbers. The taproom generates 62% of revenue but 94% of channel profit. Distribution moves similar volume but produces a 3.9% margin after allocated costs. This doesn't necessarily mean distribution is bad. It means you need to understand why and decide whether that channel deserves more investment or less.
According to the Brewers Association's national data, craft beer volume has faced pressure across all channels. That makes understanding which channel delivers real profit even more important when volumes aren't growing automatically.
Key Metrics to Track Monthly
Beyond the P&L itself, track these metrics per channel every month:
- Revenue per barrel by channel. Taproom barrels typically generate $400 to $600 per barrel. Distribution barrels might yield $150 to $280 depending on format and market. Track the trend.
- COGS per barrel by channel. Include packaging and direct labor. This number reveals whether your distribution packaging costs are eating your margin.
- Gross margin percentage by channel. Taprooms typically run 60 to 75% gross margins. Distribution runs 30 to 50%. If your numbers fall outside these ranges, investigate.
- Contribution margin per barrel. After all allocated costs, how much does each additional barrel through each channel contribute? This drives expansion decisions.
Understanding your true batch-level costs is the foundation for these channel metrics. If you haven't nailed down your per-batch cost calculation yet, start with this guide on calculating true cost per batch before attempting channel-level analysis.
Using Channel Data to Make Strategic Decisions
Once you have three to six months of channel P&L data, patterns emerge that drive real decisions:
Pricing adjustments. If distribution margins are razor-thin, you might need to raise wholesale prices, renegotiate distributor terms, or eliminate low-margin distribution SKUs. If taproom margins are strong, you have room for strategic promotions that drive foot traffic without destroying profitability.
Capital allocation. Should you invest in a canning line to grow distribution, or expand your taproom seating? Channel P&L data gives you projected ROI by channel instead of guessing.
Product mix optimization. Some beers perform better in the taproom (high-ABV specialties, limited releases) while others suit distribution (flagships, session beers). Channel data helps you allocate tank time and production capacity to the most profitable products in each channel.
Staffing decisions. If taproom labor costs are climbing faster than taproom revenue, you need either more efficient scheduling or higher per-transaction revenue. If distribution delivery costs are ballooning, it might be time to shift from self-distribution to a distributor partnership.
Putting It All Together With the Right Systems
The biggest obstacle to channel-level financial tracking isn't the accounting knowledge. It's the data pipeline. If your production, inventory, and sales data lives in disconnected spreadsheets, building accurate channel P&Ls becomes a monthly headache that eventually gets abandoned.
The breweries that successfully maintain channel-level tracking share a common trait: they use integrated systems where production data, inventory costs, and sales orders live in one place.
Here's what that workflow looks like in practice:
- 1A batch gets brewed. Raw material costs are captured automatically based on the recipe and actual ingredient usage. Tank time is logged.
- 2The batch moves to packaging. Packaging materials consumed are tracked by format (kegs, cans, bottles), creating format-specific packaging costs per barrel.
- 3Finished goods hit inventory. Each SKU carries a landed cost that includes raw materials, packaging, and allocated production labor.
- 4Sales orders ship. Orders tagged by channel (taproom POS vs. distribution invoice) deduct inventory and record revenue in the correct channel account.
- 5Reports generate. Monthly channel P&Ls pull from production costs, inventory movements, and sales data without manual reconciliation.
This kind of connected workflow is exactly what BrewPlanner's brewery management platform is built for. When your batch scheduling, inventory tracking, and sales order management share a single data backbone, channel-level financial reporting becomes a byproduct of running your brewery, not a separate accounting project.
A Simple Action Plan to Get Started
You don't need to overhaul everything at once. Start with these steps:
- Audit your current chart of accounts and add channel-specific revenue sub-accounts
- Separate COGS into raw materials, packaging, direct labor, and freight
- Choose your allocation method for shared costs and document it
- Set up a monthly channel P&L template (even a spreadsheet works to start)
- Track revenue per barrel and COGS per barrel by channel for three consecutive months
- Review the data quarterly with your leadership team and adjust strategy
The goal isn't perfection on day one. It's building the habit of looking at your brewery through a channel-profitability lens. Even rough numbers split by taproom and distribution will reveal insights that a single blended P&L never could.
Your taproom and distribution operations are fundamentally different businesses sharing a production floor. It's time your financial tracking reflected that reality. Start with the chart of accounts, get your cost data flowing cleanly, and within a few months you'll wonder how you ever made strategic decisions without this visibility.