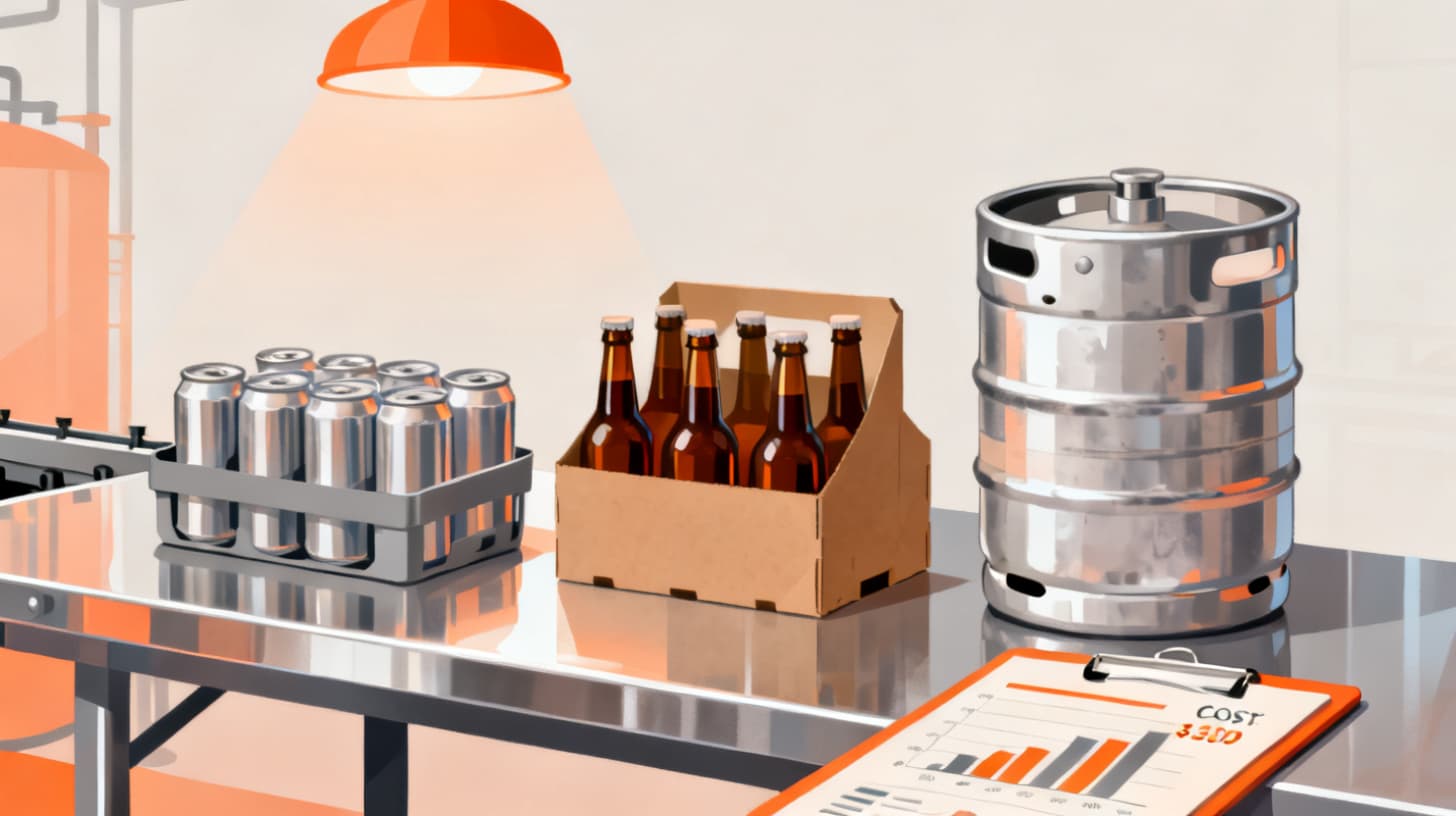
A 16-oz four-pack of hazy IPA and a half-barrel keg of the same beer start with the same wort. But by the time each reaches a customer, they've traveled wildly different cost paths. Packaging materials, labor intensity, distributor margins, shelf-life risk, and excise taxes all shift depending on format. Most brewery owners have a gut feeling about which SKUs make money and which ones don't. Gut feelings, though, aren't a financial strategy.
Per-SKU profitability analysis gives you the actual numbers behind every format you sell. It tells you whether your 12-oz cans are subsidizing your draft accounts, whether that seasonal 750ml bottle is a vanity project or a profit engine, and where you're leaving real dollars on the table. Getting there requires connecting your bill of materials, production costs, and packaging expenses down to the individual unit. Tools like BrewPlanner's inventory management with MRP make this kind of granular cost tracking possible by linking raw materials, packaging supplies, and batch data into a single system.
This guide walks through the full process of building a per-SKU profitability model, from identifying true costs to comparing margins across package formats and making smarter decisions about your product lineup.
Building a True Cost Model for Each Package Format
The biggest mistake breweries make with profitability analysis is stopping at ingredient costs. Yes, grain, hops, yeast, and water matter. But for most craft breweries, raw ingredients account for only 20-30% of the total cost to produce a finished, packaged unit. The rest hides in places that are easy to overlook.
A true per-SKU cost model needs to account for every dollar that touches a product from brewhouse to customer.
Direct Material Costs
Start with your bill of materials (BOM) for each recipe. This includes malt, hops, yeast, adjuncts, water treatment chemicals, and any other ingredients that go into the tank. Calculate the cost per barrel of finished beer, then convert that to a cost per unit based on package size.
For example, if your pale ale costs $85 per barrel in raw ingredients, that works out to roughly $0.27 per 12-oz can, $0.69 per 32-oz crowler, or $2.74 per sixth-barrel keg. Same beer, same ingredients, but the per-unit math changes immediately once you start dividing.
Next, layer in packaging materials. This is where formats start to diverge sharply:
Material12-oz Can16-oz Can (4-pack)22-oz Bottle1/6 BBL KegContainer$0.08$0.10$0.18$14.50 (amortized)Label/Shrink$0.03$0.04$0.06$0.15Carrier/Box$0.05$0.12$0.08—Lid/Cap/Seal$0.02$0.02$0.01$0.25Total Packaging$0.18$0.28$0.33$14.90
These numbers will vary by supplier and volume, but the pattern holds. Cans are cheap per unit. Bottles cost more. Kegs have high upfront costs that amortize over hundreds of fills, but replacement, maintenance, and deposit tracking add hidden expenses over time.
If you've already mapped out your cost-per-batch calculations, you're halfway there. For a deeper walkthrough of that foundational step, check out how to calculate true cost per batch in your brewery.
Indirect and Allocated Costs
Here's where most spreadsheet-based models fall apart. Indirect costs are real, they're significant, and they hit different SKUs differently.
Labor is the big one. Canning a 15-barrel batch into 12-oz cans might take a three-person crew four hours. Kegging the same batch might take one person ninety minutes. If your loaded labor rate (wages, benefits, taxes) is $25/hour, that's $300 for the canning run versus $37.50 for kegging. Spread across the units produced, canning labor adds roughly $0.06 per can, while kegging labor adds about $0.63 per keg. Not a dealbreaker for kegs, but it's a real number that belongs in your model.
Equipment depreciation and maintenance should be allocated proportionally. Your canning line, labeler, and depalletizer serve only packaged product. Your keg washer serves only draft. Assign annual costs to the formats they support, then divide by projected annual volume.
Utilities, facility overhead, and insurance are trickier. A common approach is to allocate these based on production time. If canning takes up 60% of your packaging schedule, it absorbs 60% of packaging-related overhead.
Finally, don't forget excise taxes. Federal excise tax rates from the TTB apply per barrel regardless of package format, but state taxes sometimes vary by container type or sales channel. Build the applicable tax per unit into your model.
Comparing Margins Across Draft, Cans, and Bottles
Once you've built a complete cost-per-unit for each SKU, you need to set it against revenue. And revenue isn't just your retail price. It's the net amount that actually lands in your bank account after distributor margins, retailer markups, and any promotional allowances.
This is where per-SKU profitability analysis gets genuinely illuminating, and sometimes uncomfortable.
Mapping Revenue by Channel
Most breweries sell through a combination of channels, and each one delivers a different revenue-per-unit:
- Taproom/direct-to-consumer: You keep the full retail price minus credit card fees and any applicable sales tax obligations. A $16 four-pack of 16-oz cans nets you roughly $14.80 after processing fees.
- Self-distribution: You sell to retailers at wholesale, typically 25-35% below suggested retail. That $16 four-pack might leave you with $10.40-$12.00.
- Three-tier distribution: The distributor takes their margin (often 28-35%), then the retailer takes theirs. Your revenue on that same four-pack could drop to $7.50-$9.00.
- Draft accounts: A half-barrel keg might sell for $180-$220 to a distributor, who marks it up to $240-$280 for the bar. Your net is the wholesale price minus any delivery or tap incentive costs.
The key insight here is that your highest-volume channel might not be your most profitable one. A brewery moving 70% of its volume through distribution at thin margins could be generating less total profit than the 30% it sells directly from the taproom.
Building a Margin Comparison Table
Here's a simplified example for a single recipe sold across four formats and two channels:
Metric12-oz Can (6-pack)16-oz Can (4-pack)Draft (1/2 BBL)22-oz BottleTotal Cost/Unit$0.52$0.98$128.50$1.85Taproom Revenue$1.67$3.70N/A$6.50Distributor Revenue$0.98$2.10$195.00$3.80Taproom Margin$1.15 (69%)$2.72 (74%)N/A$4.65 (72%)Distributor Margin$0.46 (47%)$1.12 (53%)$66.50 (34%)$1.95 (51%)
Look at how dramatically the picture shifts between channels. The 16-oz four-pack sold through the taproom is a margin powerhouse at 74%. That same product through distribution drops to 53%, which is still healthy. Draft, often assumed to be the most profitable format because of lower packaging costs, actually delivers the slimmest margin percentage once you account for keg logistics, deposits, and distributor cuts.
None of these numbers are universal. Your costs, pricing, and channel mix will produce different results. The point is that you can't know which SKUs are carrying the business without doing this math for your specific operation.
BrewPlanner's brewery management platform connects your recipe BOMs, batch production data, inventory costs, and reporting into one system, making it far easier to build and maintain these comparisons without juggling disconnected spreadsheets.
Turning Profitability Data Into Better Decisions
Numbers on a spreadsheet are useless if they don't change behavior. The real value of per-SKU profitability analysis comes from the decisions it enables. Here are the most impactful actions breweries take once they have clear margin data by format.
SKU Rationalization
Most craft breweries carry too many SKUs relative to their production capacity. Every format and recipe combination requires its own packaging materials, label inventory, production scheduling slot, and sales effort. If a SKU generates thin margins and modest volume, it's consuming resources that could go toward higher-performing products.
A structured approach works best:
- 1Rank every SKU by gross profit dollars, not just margin percentage. A 40% margin on a high-volume SKU might generate more total profit than an 80% margin on something you sell twelve cases of per month.
- 2Flag the bottom 20% of SKUs by total profit contribution.
- 3Evaluate each flagged SKU against strategic criteria. Does it serve an important account? Does it drive taproom traffic? Is it a new product still building volume?
- 4Retire, reformulate, or reformat SKUs that can't justify their existence on either financial or strategic grounds.
For a detailed framework on running this process, this guide on brewery SKU rationalization using margin data walks through each step.
Pricing Adjustments
Per-SKU data often reveals that some products are underpriced relative to their costs. This is especially common with specialty or limited-release beers packaged in expensive formats. If your barrel-aged stout in 500ml bottles carries a 22% margin, you probably have room to raise the price, particularly if comparable products in your market sell for more.
Conversely, you might find that an aggressively priced flagship in 12-oz cans is your best profit generator because of sheer volume. Protecting that product's margin through supplier negotiations or packaging efficiency improvements could be more valuable than any price increase on a niche SKU.
Format and Channel Optimization
Sometimes the right move isn't to kill a recipe but to change how you package or sell it. Common pivots include:
- Shifting volume from distribution to taproom for high-margin formats where you have the foot traffic to support it
- Dropping a bottle format in favor of cans when the margin difference is significant and customer demand supports it
- Increasing keg prices for draft accounts where you've historically undercharged because "kegs are cheap to fill" (they're not, once you count everything)
- Introducing a new format for a popular recipe, like adding a 16-oz four-pack to capture higher per-ounce revenue from a beer you currently only sell in 12-oz six-packs
Forecasting and Capacity Planning
Once you know the margin per unit for every SKU, you can model scenarios. What happens to total profitability if you shift 10% of production from draft to packaged? What if you add a second canning run per week and cut a slow-moving bottle SKU? What's the break-even volume for that new variety pack you're considering?
This kind of modeling requires accurate, connected data. Craft brewery software built for this kind of analysis links batch scheduling, inventory, and costs together so your forecasts are built on real numbers instead of estimates.
Putting It All Together With Consistent Tracking
A one-time profitability analysis is valuable. A continuously updated profitability model is transformative. The breweries that maintain clear visibility into per-SKU margins over time can spot trends, react to cost increases before they erode profits, and make investment decisions with confidence.
The practical challenge is data discipline. Your cost model is only as accurate as the inputs feeding it. That means:
- Updating ingredient costs every time you receive a purchase order, not just once a quarter
- Tracking packaging material costs at the item level, including freight and minimum order surcharges
- Recording actual labor hours per packaging run, not theoretical estimates
- Reconciling yield losses so your per-unit math reflects what actually gets into the package, not what the recipe says should be there
- Reviewing distributor and retailer pricing regularly to keep revenue-per-unit current
This is a lot to manage in spreadsheets, especially as your number of SKUs, suppliers, and sales channels grows. An integrated system that connects your raw material inventory, production batches, packaging BOM, and sales data eliminates most of the manual reconciliation work.
The difference between breweries that grow profitably and those that grow into a cash flow crisis is almost always visibility. Knowing your true cost per unit, per format, per channel is how you stop guessing and start managing.
If you don't have a system tracking these numbers today, start with the highest-impact data point: your fully loaded cost per package for your top five SKUs. Build the model described above for just those products. Compare them against actual revenue by channel. The clarity you gain from even that limited exercise will likely change at least one decision you're about to make.
Ready to stop guessing and start tracking per-SKU profitability across your entire operation? Explore BrewPlanner's pricing plans and see how an integrated brewery ERP connects your costs, batches, and inventory into the profitability picture you've been missing.